Stepping into a new CIO role—whether in the public sector, healthcare, manufacturing, or enterprise—is equal parts opportunity and immense pressure. The mandate is clear: demonstrate value quickly, optimize spend, drive innovation, and ensure operational resilience, all while navigating complex legacy systems and organizational politics.
Traditional vendor solutions often focus on a single point problem. But what the modern CIO needs is a strategic acceleration partner—one that provides the intelligence, flexible resources, and proven frameworks to succeed from day one.
We have built partnership models designed specifically for those moments. We don’t just sell services; we become an extension of your leadership team, focused on making your tenure a demonstrable success.
The Four Pillars of CIO Enablement
Our framework is built on four core pillars that address the universal challenges of a new technology leadership role.
1. Gain Immediate Control with Operational Intelligence
You can’t manage what you can’t see. Before making sweeping changes, you need a clear, real-time picture.
-
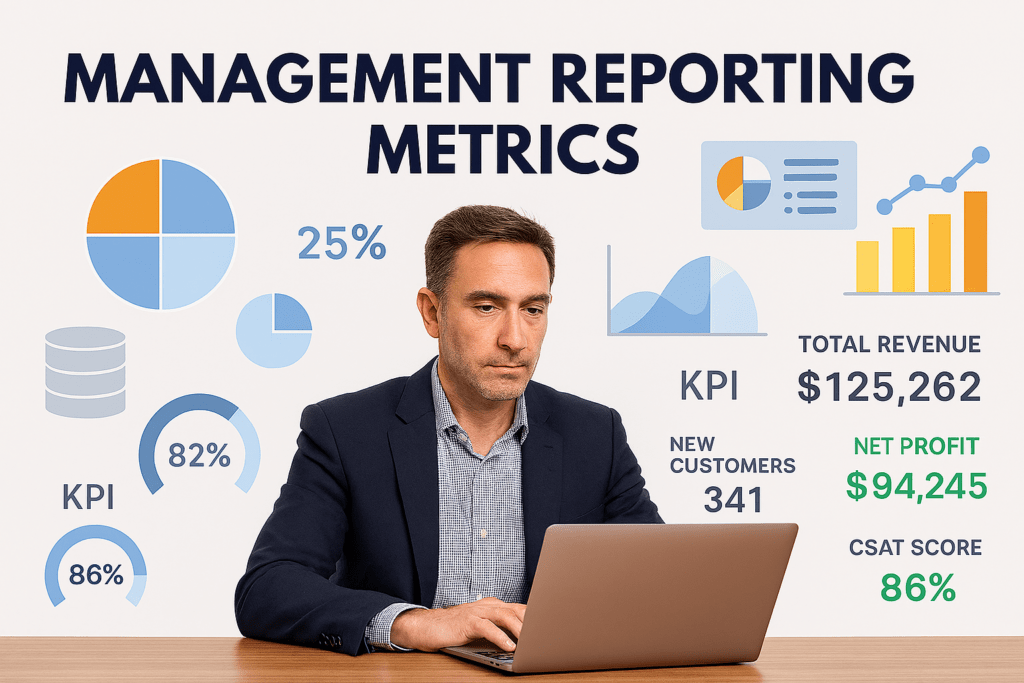
Our Approach: We rapidly deploy a CIO Dashboard that aggregates data from your existing tools—ticketing, monitoring, project management—into a single pane of glass. Track KPIs, project health, budget burn, and system performance.
-
Your Outcome: Data-driven credibility. Walk into executive meetings with facts, not anecdotes, and communicate your department’s value with transparency.
2. Stop Fighting Fires & Start Preventing Them
A reactive IT organization is a cost center. A proactive one is a strategic asset. Chronic incidents drain budget, morale, and your team’s capacity for innovation.
-
Our Approach: Our Proactive Incident Reduction Program uses root cause analysis, pattern identification, and predictive monitoring to tackle the source of problems. We aim not just to resolve tickets faster, but to eliminate entire categories of tickets before they occur.
-
Your Outcome: Reduce incident volume by 30-50%. Free your top talent from break-fix cycles, improve end-user satisfaction, and redirect resources toward strategic projects that deliver business value.
3. Optimize Spend to Fund Your Vision
Budget constraints are a reality. The key is not just cutting costs, but strategically reallocating funds from legacy “keep-the-lights-on” activities to future-focused initiatives.
-
Our Approach: We conduct a Strategic Portfolio & Spend Assessment, identifying redundancies in software, underutilized licenses, and vendor rationalization opportunities. We find the trapped capital in your current stack.
-
Your Outcome: A roadmap to fund your key priorities—whether that’s cloud migration, security hardening, or a new data analytics platform—without needing a larger budget.
4. Build Resilient Capacity Without Adding Headcount
The demand for IT services always outpaces fixed headcount. Hiring is slow, and contractors can be expensive and transient. You need flexible, scalable expertise.
-
Our Approach: Our Flexible Support Augmentation Model provides fixed-fee, annual retainers for L1/L2 support, application management, and after-hours coverage. We integrate with your processes and act as a seamless extension of your team under your direction.
-
Your Outcome: Achieve bench strength and 24/7 resilience. Smooth out demand spikes, cover skill gaps, and give your permanent staff the bandwidth to focus on architecture, innovation, and deep business partnership.
The Partner Difference: We Make You & Your Team the Heroes
Our philosophy is built on augmentation, not replacement. We succeed only when you and your internal team succeed.
-
We Work in Your Shadow: Our experts integrate and execute under your leadership. You own the strategy; we help implement it.
-
Knowledge Transfer is Built-In: We build playbooks and documentation alongside you, strengthening your institutional muscle.
-
Language of Enablement: We focus on “capacity freeing,” “skills augmentation,” and “co-sourcing” to ensure organizational buy-in and protect team morale.
-
Discretion & Confidentiality: Initial assessments and strategic briefings are conducted with the utmost discretion, providing you with the unbiased insight needed to lead effectively.
From First 100 Days to Long-Term Legacy
Whether you need a confidential “first 100 days” briefing on the landscape you’ve inherited, a quick-win project to build early momentum, or a long-term partner to operationalize your vision, our model scales to meet you where you are.
The goal is to transform the IT department from a cost center into a recognized engine of value, agility, and innovation. Let’s discuss how a strategic partnership can provide the leverage you need to not just meet expectations, but exceed them.
Ready to accelerate your impact? [Contact us today] for a confidential conversation about your priorities.