3D Rendering Services

3D RENDERING SERVICES
Our 3D rendering services transform your product ideas into stunningly realistic and detailed digital images. By creating a virtual model of your product, we eliminate the need for costly physical prototypes and complex photoshoots. This powerful tool allows you to showcase your design from any angle, in any environment, and with any material or color variation long before it goes into production. The result is a faster, more cost-effective, and incredibly flexible way to create compelling marketing visuals, secure stakeholder buy-in, and accelerate your time to market.

3D PRODUCT RENDERING

3d product rendering Exploded version Product user experience

Explore the power of our versatile rendering styles to enhance your marketing performance:

  • Lifestyle & Contextual Scenes: Place your product in custom-built environments that tell a story and connect with your target audience.

  • Exploded-View & Cutaways: Showcase technical sophistication, internal components, and unique engineering to highlight build quality and functionality.

  • 360° Spin Animations: Boost engagement and conversion by allowing customers to interactively explore your product from every angle.

  • Color & Material Variations: Instantly visualize different finishes, fabrics, and configurations in a single, cohesive scene to streamline decision-making.

Beyond stunning visuals, our 3D rendering delivers decisive business advantages. We offer competitive pricing that consistently undercuts the high costs of traditional photoshoots, prototypes, and sample production. This efficiency, combined with a streamlined digital workflow, leads to a dramatically faster production timeline for your marketing assets. You gain the agility to launch campaigns sooner and adapt to market changes instantly, all while significantly reducing overhead and accelerating your return on investment.

Check out our Portfolio

We also provide 2D, SFX and other architectural rendering services.

Contact US today 

Resources

What is 3D rendering? | Adobe Substance 3D

3D Rendering Software | Tools and Free Resources | Autodesk

Why a Management Reporting System is Your Key to Proactive Leadership

Beyond the Spreadsheet: Why a Management Reporting System is Your Key to Proactive Leadership

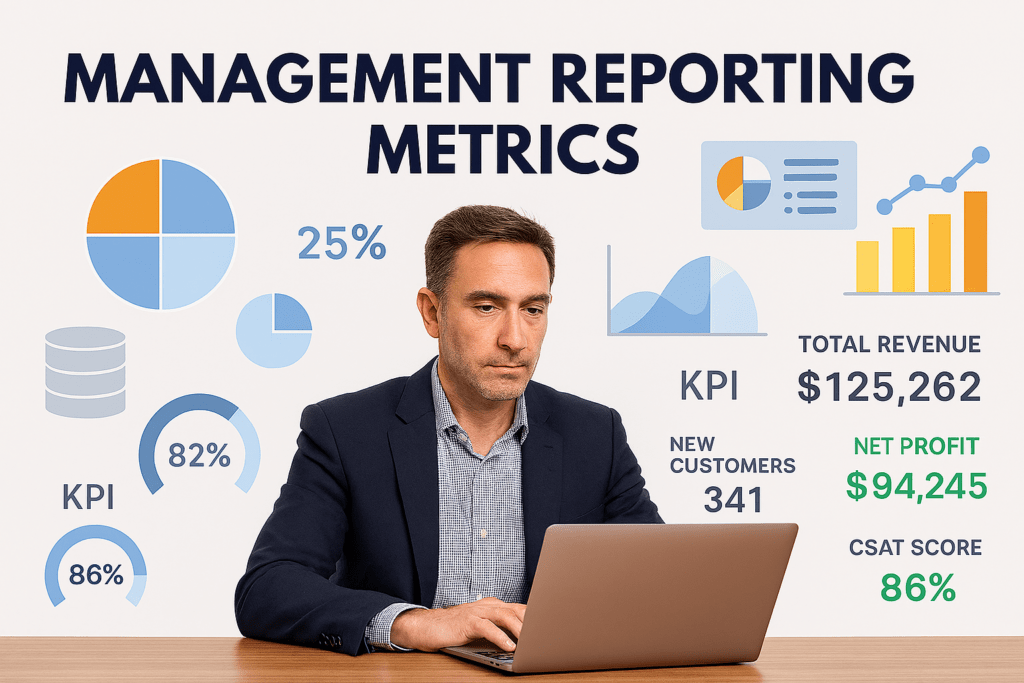
Management Reporting

In today’s fast-paced business environment, without true management reporting, running a company on gut feeling or outdated reports is like sailing a ship through a storm with a blurred map. Department Managers and C-level Executives are tasked with making critical decisions every day. But without a clear, accurate, and timely view of what’s happening across the organization, those decisions are based on guesswork, not knowledge.

This is where a modern Management Reporting System (MRS) transitions from a “nice-to-have” IT tool to an essential strategic asset. It’s the engine that transforms raw data into actionable intelligence, empowering leaders at every level to steer the company with confidence.

What is a Management Reporting System?

At its core, an MRS is a centralized platform that automatically gathers data from across your organization—from sales and marketing to finance, operations, and HR. It consolidates this information into intuitive dashboards and reports, providing a single source of truth. Think of it as moving from a pile of disjointed spreadsheets to a dynamic, interactive command center.

The Essential Value for Department Managers and C-Level Executives

The power of an MRS lies in its ability to serve both the high-level strategic needs of the C-suite and the detailed, operational focus of department managers.

For the C-Level Executive: The 30,000-Foot View with Drill-Down Capability

C-level executives need to answer big-picture questions: Are we profitable? Are we growing? What are our key risks and opportunities? An MRS provides:

  • A Unified, Real-Time Overview: The CEO and CFO can log in each morning to a dashboard showing Key Performance Indicators (KPIs) like company-wide revenue, cash flow, customer acquisition costs, and overall profitability. This holistic view eliminates surprises and aligns the leadership team.

  • Strategic Alignment: Easily track progress against strategic goals. If the objective is to increase market share in a specific region, the MRS can show relevant metrics, allowing executives to see if the strategy is working without waiting for end-of-quarter manual reports.

  • Informed Strategic Shifts: When you spot a trend—like a dip in profitability—you don’t have to wonder why. With drill-down capabilities, you can click on that metric to see which product line, region, or department is driving the change. This turns a high-level alert into a targeted investigation.

For the Department Manager: The On-the-Ground Operational Intelligence

Department managers are in the trenches, and their success depends on granular, timely data. An MRS equips them to:

  • Optimize Daily Operations: A Sales Manager can monitor the team’s pipeline, conversion rates, and average deal size in real-time. An Operations Manager can track inventory levels, production efficiency, and quality control metrics. This allows for immediate adjustments to improve performance.

  • Empower Data-Driven Accountability: Managers can clearly see which initiatives are working and which are not. They can allocate resources more effectively, whether it’s shifting marketing spend to a high-performing channel or addressing a bottleneck in the service delivery process.

  • Foster Proactive Management: Instead of reacting to last month’s problems, managers can be proactive. For example, if the MRS shows a rising trend in customer support ticket resolution time, the Support Manager can investigate and allocate staff before it becomes a major customer satisfaction issue.

The Power of Proactive Knowledge: From Reactive to Predictive

The ultimate benefit of a robust Management Reporting System is the shift from a reactive to a proactive and predictive operational model.

  1. Identify Trends, Not Just History: Static reports tell you what already happened. A dynamic MRS helps you see what is happening. By visualizing data over time, you can identify trends—both positive and negative—as they emerge.

  2. Improve Forecasting Accuracy: With a clear historical and current view of performance, forecasting becomes more reliable. You can base future budgets and strategies on solid data trends rather than assumptions.

  3. Enhance Cross-Departmental Collaboration: When sales, marketing, and finance all look at the same data, silos break down. A shared understanding of metrics leads to more productive conversations and aligned goals across the organization.

Conclusion: An Investment in Clarity and Control

A Management Reporting System is no longer a luxury reserved for large corporations. It is a fundamental tool for any organization that values clarity, agility, and data-driven decision-making. For C-level executives, it provides the strategic oversight needed to guide the company. For department managers, it delivers the operational insights required to excel in their roles.

By implementing a modern MRS, you empower your entire leadership team to move beyond simply reporting on the past and start actively shaping a more successful and predictable future.

We have implemented comprehensive management reporting systems for Mid, Large Organizations including Broadcast, Financials and more.  Check out our Case Studies.

Ready to turn your data into your greatest strategic advantage?

Contact Us to learn more about our initiatives in this area.


Resources:

What Is a KPI Dashboard | Microsoft Power BI

Here’s how Microsoft executives are using Power BI | Blog di Microsoft Power BI | Microsoft Power BI


How to Use Forecasting in Power BI 

  1. Key Forecast Options in Power BI
    When using the built-in forecasting feature, you can configure the following options:
    a. Forecast Length
    • Specify how far into the future you want to forecast (e.g., 12 months, 24 months).
    • This determines the number of data points Power BI will predict.
    b. Confidence Interval
    • Set the upper and lower bounds for the forecast (e.g., 95% confidence interval).
    • This provides a range within which the actual values are likely to fall.
    c. Seasonality
    • Specify the seasonality period (e.g., 12 for monthly data with yearly seasonality).
    • Power BI uses this to account for recurring patterns in the data.
    d. Ignore Last
    • Exclude a certain number of data points from the forecast calculation.
    • Useful if the most recent data is incomplete or unreliable.
    2. Advanced Forecasting with DAX
    For more advanced forecasting, you can use DAX (Data Analysis Expressions) to create custom
    calculations. Examples include:
    • Moving Averages: Calculate rolling averages to smooth out trends.
    • Linear Regression: Use statistical functions like LINEST to predict future values.
    • Exponential Smoothing: Apply weighted averages to emphasize recent data points.
    3. Integration with Azure Machine Learning
    Power BI can integrate with Azure Machine Learning to leverage advanced forecasting models,
    such as:
    • ARIMA (AutoRegressive Integrated Moving Average)
    • Prophet (developed by Facebook for time series forecasting)
    • Neural Networks
    This requires setting up an Azure Machine Learning workspace and deploying a model.
    4. Custom Visuals for Forecasting
    Power BI supports custom visuals from the AppSource marketplace that can enhance
    forecasting capabilities. Examples include:
    • Forecasting Chart by MAQ Software: Provides advanced forecasting options.
    • Time Series Forecasting by Microsoft Research: Offers robust time series analysis tools.
    5. R and Python Integration
    Power BI allows integration with R and Python scripts for advanced forecasting. You can:
    • Use libraries like forecast in R or prophet in Python.
    • Create custom visualizations and predictions directly in Power BI.
    6. Quick Insights
    Power BI’s Quick Insights feature can automatically detect trends and patterns in your data,
    which can be used as a starting point for forecasting.
    7. Scenario Analysis with What-If Parameters
    While not strictly forecasting, What-If Parameters allow you to simulate different scenarios and
    predict outcomes based on variable inputs.


Forecast Charts

1. Prepare Your Data: Ensure your data has a time-based column and is clean.
2. Create a Line Chart: Add a line chart to your report and include the time-based column
and the metric you want to forecast.
3. Enable Forecasting: Go to the Analytics pane, select the line chart, and enable the
Forecast option.
4. Customize Settings: Adjust the forecast length, confidence interval, and seasonality as
needed.
5. Analyze Results: Review the forecasted values and confidence intervals to make data
driven decisions.

References:

Introducing new forecasting capabilities in Power View for Office 365 | Microsoft Power BI Blog | Microsoft Power BI

Describing the forecasting models in Power View | Microsoft Power BI Blog | Microsoft Power BI